Being Model-Driven: Lessons from Rev Data Science Summit
Angela Tran Kingyens2018-06-19 | 3 min read
By Angela Tran Kingyens, PhD, version one ventures on June 19, 2018 in
Thanks to Angela Tran Kingyens, PhD at version one ventures, for contributing this guest blog. It was originally published to the version one site here.
A few weeks ago, I attended Rev, a summit for data science leaders and practitioners organized by Domino. I have previously shared blog posts on the key takeaways from last year’s event (which was one of the best data science conferences I’d been to), including how to define a data scientist and the differences between data science and data engineering.
This year, one of the core themes was the management of data science projects. I had never thought about it this way before, but in fact, models are the output of a data scientist’s work.
My biggest takeaway was the realization that when it comes to building products and businesses, it’s important not only to be data-driven, but also to be model-driven.
What does it mean to be model-driven?
If data is oil, then the model is the engine. Data, and code for that matter, can be unitized, whereas models are more complex. Models are effectively created with data and code as building blocks. As a result, models can’t be treated in the same way as data or code, and there are definitely best practices for managing the data science lifecycle.

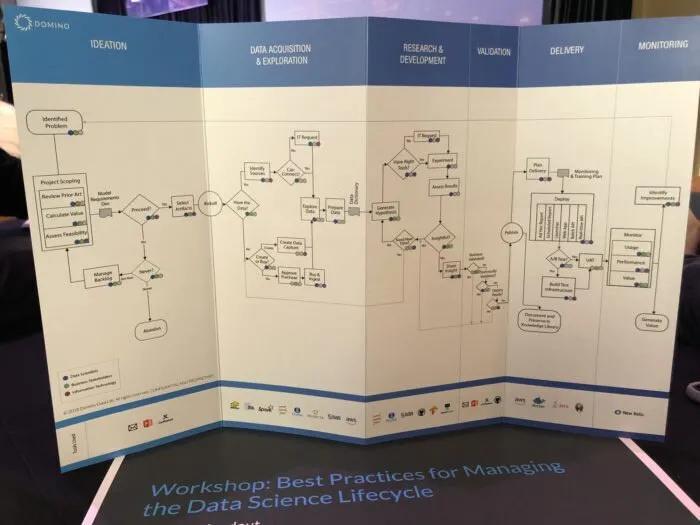
Generally speaking, the overall data science lifecycle can be viewed in an aggregate of stages:
- Ideation: when project feasibility and prioritization are assessed
- Data acquisition and preparation: understanding data availability, accessibility and cost of data acquisition
- Research and development: establishing the experimental method (which includes the hypothesis generation, model selection, KPIs, standards) for iteration
- Validation: rigorously evaluating of data assumptions, code base, model performance and prediction results
- Delivery: productizing the mathematical results of the model (i.e. deploying the model into the product itself or as reports and dashboards)
- Monitoring: measuring the impact of the model on users’ actual behaviour once it goes live
Most of us likely have intentionally plotted just a few of these stages. While it might take a lot of work to put a comprehensive workflow like this in place, the biggest benefit is that we can truly measure everything. This hopefully translates to greater efficiency and more effective collaboration between all stakeholders, with more auditability and reproducibility.
SHARE

Subscribe to the Domino Newsletter
Receive data science tips and tutorials from leading Data Science leaders, right to your inbox.
By submitting this form you agree to receive communications from Domino related to products and services in accordance with Domino's privacy policy and may opt-out at anytime.